A Virtual Electrophysiology Lab, rebuilt for the browser

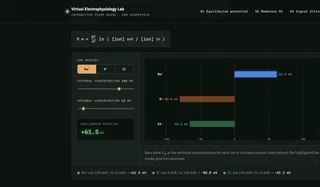
From a 2019 Colab notebook to a validated, zero-install interactive lab
Back in 2019, teaching Electrophysiology of the Central Nervous System, I built a Google Colab
notebook to give students something to interact with instead of just static slides: adjust ion
concentrations and watch the equilibrium potential update, compare RC charge/discharge curves for
different cell sizes, isolate a noisy signal with a Butterworth filter. It worked, but it needed a
Google account, Colab’s #@param form fields, and a Bokeh widget API that’s been deprecated for
several major releases now. It was also entirely in Portuguese.
This month I rebuilt it properly. Try it below.
What changed
Language and stack. Everything is in English now, and there are two independent implementations of the same three modules:
- A zero-install browser version (embedded above) — vanilla JS and hand-drawn SVG charts, no frameworks, no build step.
- A Python package + Panel app — the physics factored out into small, tested functions with no plotting or widget imports at all, so they’re trivial to reuse or verify independently of the UI.
Both are on GitHub: gbnegrini/virtual-electrophysiology-lab.
The original 2019 notebook is kept in the repo’s original/ folder, unmodified, for anyone
curious what “before” looked like.
A from-scratch Butterworth filter, checked against SciPy. The signal-filtering module needed
a 6th-order zero-phase Butterworth filter running client-side, in the browser, with no
dependencies. Rather than approximate one, I implemented the actual filter design pipeline —
analog prototype poles, the bilinear transform, filtfilt’s zero-phase forward/backward pass with
proper edge handling — in plain JavaScript, then validated it numerically against
scipy.signal.butter + filtfilt on the same test signal. It matches to less than 1e-8 absolute
error across the filter’s usable cutoff range. The Python repo runs the real scipy call, so both
versions agree by construction, not by eyeballing two plots that happen to look similar.
Testing. The Python package has a small pytest suite checked against the textbook reference values from the original notebook (Na⁺, K⁺, and Cl⁻ equilibrium potentials; the two reference cells’ RC time constants), with CI running on every push.
The three modules
- Equilibrium potential — the Nernst potential of an ion as a function of its valence and the concentration ratio across the membrane, with live-updating bars for Na⁺, K⁺, and Cl⁻ against their textbook physiological concentrations.
- Passive membrane properties — the RC time constant of the neuronal membrane, comparing charge/discharge curves between a large and a small reference cell (and a fully custom one, on log-scale sliders spanning both).
- Electronic filters — a composite signal made of three sine waves, with low-pass/high-pass filtering to isolate the low-frequency signal from simulated high-frequency noise, exactly the kind of thing you actually do to a real electrophysiological recording.
If you use this for teaching or reference, both the code (MIT) and the instructional text/exercises (CC BY-NC 4.0) are free to reuse — the README has the details.
